
From Basics to Brilliance: Multiplication Chart and Academic Excellence
Introduction:
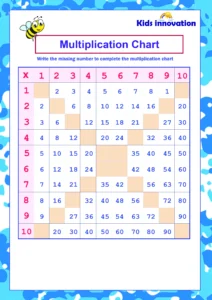
Multiplication chart are visual tools that display the products of multiplying numbers. They provide a structured layout where rows and columns represent specific factors, and the intersection of these factors displays the result. This visual representation helps individuals grasp multiplication patterns, identify relationships between numbers, and quickly find products, fostering a better understanding of multiplication concepts through visual organization.

History of multiplication chart:
Unlocking Young Minds: Dive into the World of Learning with Our Kindergarten Quiz
Give your kids a challenge about multiplication charts

Ancient Babylonian Mathematics (2000 BCE):
The Babylonians used tables resembling multiplication charts on clay tablets to assist in complex calculations related to astronomy and geometry.
These early multiplication tables demonstrated the Babylonians’ advanced understanding of mathematics for their time.
Islamic Golden Age (8th to 14th centuries):
Scholars during this period, such as Al-Khwarizmi, extensively used multiplication tables to advance algebra and arithmetic.
The development of these tables played a crucial role in preserving and transmitting mathematical knowledge from ancient civilizations to the Western world.
Renaissance Europe (15th to 17th centuries):
As mathematical knowledge spread during the Renaissance, printed multiplication tables became popular in instructive materials.
These tables were widely used in schools, aiding students in learning multiplication and arithmetic, contributing to the rise of numeracy in society.
18th and 19th-century Education Reform:
Multiplication Charts were integrated into course readings and instructive materials during the period of education reform in Europe and the US.
This integration aimed to standardize mathematical education and provide a visual aid for students to grasp multiplication more effectively.
20th Century and the Rise of Modern Education:
Multiplication charts continued to be a staple in classrooms globally, with educators recognizing their utility in teaching multiplication tables efficiently.
The widespread use of textbooks and educational resources featuring multiplication charts contributed to a standardized approach to teaching mathematics.
Digital Age (Late 20th Century Onward):
With the advent of computers, multiplication charts transitioned into digital formats, becoming interactive tools in educational software.
Online platforms and educational apps began integrating dynamic multiplication charts, offering a more engaging and personalized learning experience.
In these historical instances, multiplication charts served as foundational tools in shaping mathematical understanding, from ancient civilizations to the digital age, demonstrating their enduring importance in education.
OverallGuides.com provides exclusive worksheets for kids, available for free download in printable PDF format.
How to read a multiplication chart Rows, Columns, and Factors:
Rows and columns are fundamental components of a tabular data structure, commonly found in spreadsheets and databases. Think of a table as a grid, where each intersection of a row and a column forms a cell.
Rows:
Definition: Rows run horizontally and represent individual records or observations in a dataset.
Role: Each row typically corresponds to a unique entry or entity in the dataset. For example, in a spreadsheet tracking sales, each row might represent a sale transaction with details like date, product, and quantity.
Columns:
Definition: Columns run vertically and represent attributes or variables associated with the data.
Role: Each column usually contains a specific type of information across all rows. Continuing with the sales example, columns might include attributes like date, product, quantity, and price.
In terms of factors:
Factors in Rows: Rows often represent instances or occurrences of the factors being studied. For instance, if you’re analyzing student performance, each row might represent a student, and the factors could include grades in different subjects.
Factors in Columns: Columns represent the different facets or characteristics (factors) being measured or observed. In the context of student performance, each column might represent a subject, and the factors could include exam scores, homework grades, etc.
Together, rows and columns allow you to organize and analyze data systematically, making it easier to draw insights or conclusions from the information presented in a structured format.
Benefits of using multiplication chart:
Visual repetition on a chart enhances memorization by leveraging the dual coding theory, engaging both visual and verbal memory systems. The visual elements provide a spatial context, aiding in the organization and recall of information. Regular exposure to the chart reinforces connections, strengthening memory through repetition and visual association. This multisensory approach fosters deeper encoding, making it more likely for the information to be retained and recalled when needed.
Creative ways to teach multiplication with charts:
Interactive tools like online multiplication games, apps, and websites can bring multiplication charts to life. Platforms such as Khan Academy, ABC mouse, and Cool Math Games offer engaging activities that make learning multiplication enjoyable for students. Additionally, interactive whiteboard apps like Explain Everything or interactive projectors can turn a traditional classroom setting into an engaging environment for exploring multiplication concepts. Augmented reality (AR) apps can also provide a unique and immersive experience, allowing students to visualize and interact with multiplication charts in a three-dimensional space.
Real-Life applications of multiplication charts:
Sure, multiplication skills are crucial in various real-life scenarios. In budgeting, calculating total expenses for multiple categories or determining the total cost of items when buying in bulk requires multiplication. In cooking, adjusting recipe quantities or converting serving sizes relies on multiplication, helping ensure accurate and delicious meals.
Conclusion:
Discover the power of multiplication chart! Unlock a world of mathematical understanding and fluency by embracing their versatility. From basic operations to complex patterns, these charts are your key to a deeper grasp of math concepts. Dive in and explore the myriad ways they can enhance your mathematical journey!